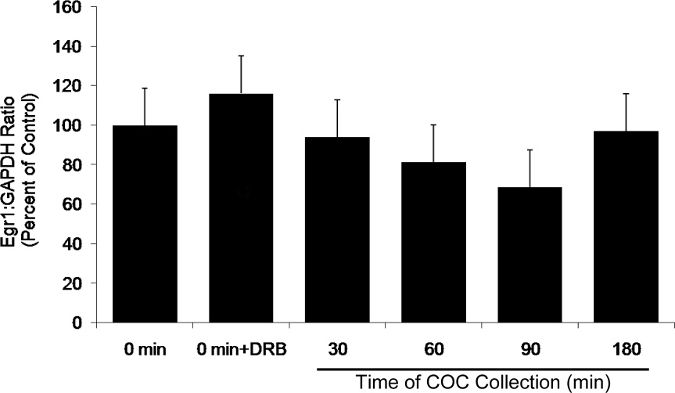
Figure 4. Pattern of expression for the candidate mRNA, Egr1, during the time course of COC collection. All treatments were cultured in the presence of FSH (lsmeans ± SEM; n = 5 replicate experiments with n = 68 ± 3 COC per treatment per replicate).
Figure 4. Pattern of expression for the candidate mRNA, Egr1, during the time course of COC collection. All treatments were cultured in the presence of FSH (lsmeans ± SEM; n = 5 replicate experiments with n = 68 ± 3 COC per treatment per replicate).