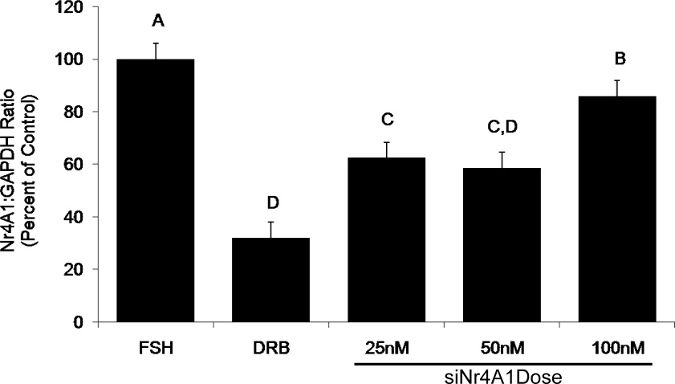
Figure 5. Effect of siRNA dose on expression of the candidate mRNA, Nr4A1. All treatment groups contain FSH (lsmeans ± SEM; n = 3 replicate experiments with n = 59 ± 4 COC per treatment per replicate; A,B,C,D P <0.05).
Figure 5. Effect of siRNA dose on expression of the candidate mRNA, Nr4A1. All treatment groups contain FSH (lsmeans ± SEM; n = 3 replicate experiments with n = 59 ± 4 COC per treatment per replicate; A,B,C,D P <0.05).