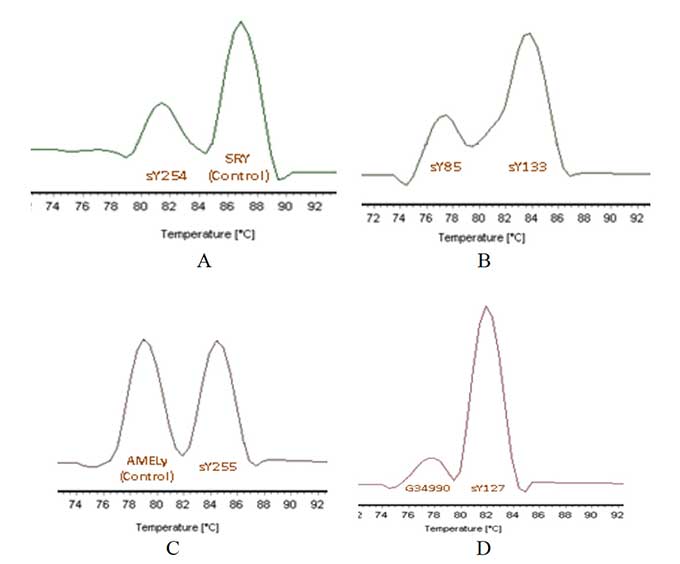
Figure 2. Melting Curves of the Duplex qPCR. The chart shows the melting temperatures of each set of primers when combined, also a deficency of the sY85, sY254 y G34990 primers is shown.
Figure 2. Melting Curves of the Duplex qPCR. The chart shows the melting temperatures of each set of primers when combined, also a deficency of the sY85, sY254 y G34990 primers is shown.