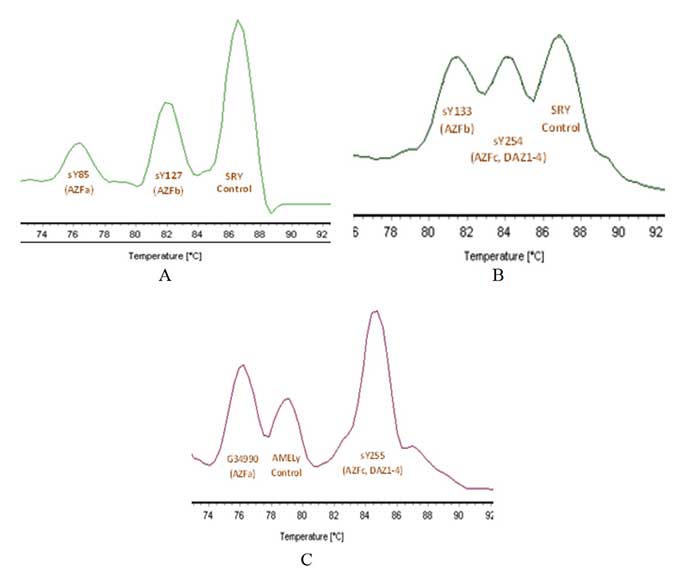
Figure 3. Melting Curves of the Triplex qPCR. The chart shows the differentiation of the melting curves of each set of primers when combined.
Figure 3. Melting Curves of the Triplex qPCR. The chart shows the differentiation of the melting curves of each set of primers when combined.