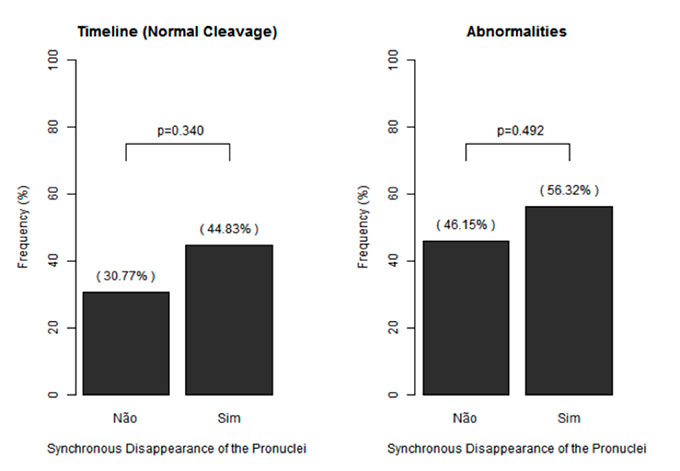
Graph 1 Bar chart for the occurrence of Timeline and abnormalities among pro-nuclei synchronous disappearance.