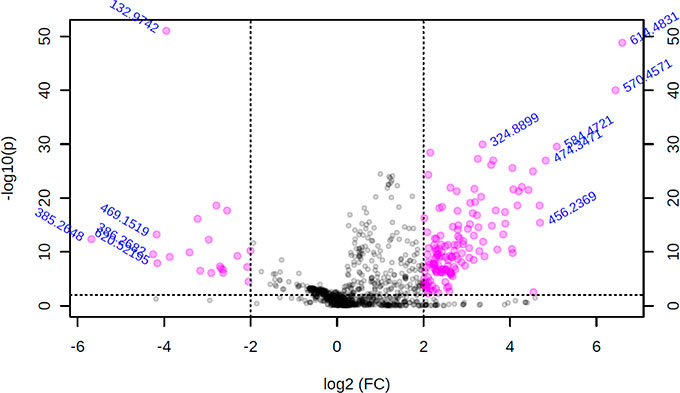
Figure 1. Volcano Plot Graphic showing ions differentially expressed between Complete-Blastocyts and No-Blastocysts groups, with a fold chance ≥ 4x and P<0.001, in the t test.
Figure 1. Volcano Plot Graphic showing ions differentially expressed between Complete-Blastocyts and No-Blastocysts groups, with a fold chance ≥ 4x and P<0.001, in the t test.