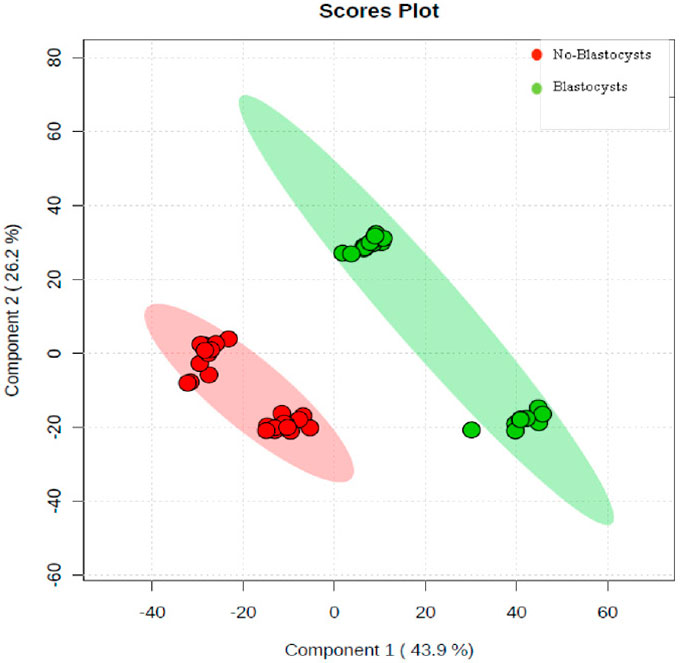
Figure 2. A Pls-Da plot of the scores for samples from the Complete-Blastocysts and No-Blastocyts groups.