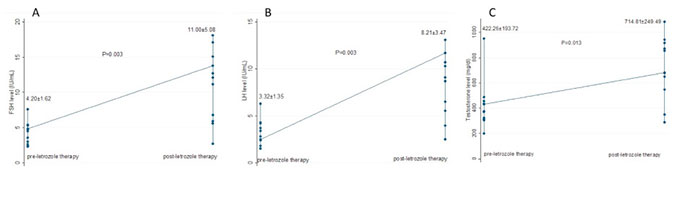
Figure 3 - Serum FSH (A), LH (B), and T (C) levels before and after a 3-month administration of letrozole in men with obstructive azoospermia undergoing PESA–ICSI cycles. The data is presented as the mean ± standard deviation. *Mann–Whitney nonparametric U test.