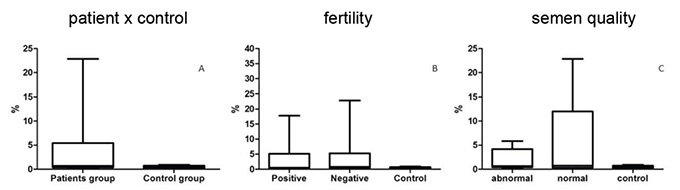
Figure 1: Representation of Whisker plots (min to max) of the data obtained from the analysis of histones in the sperm chromatin of patients undergoing in vitro fertilization procedures versus controls – males whose partners have had spontaneous pregnancies within less than 12 months (A). Patients positive for pregnancy versus individuals negative for pregnancy versus controls (B); Patients grouped according to sperm quality into abnormal, normal, and controls (C).