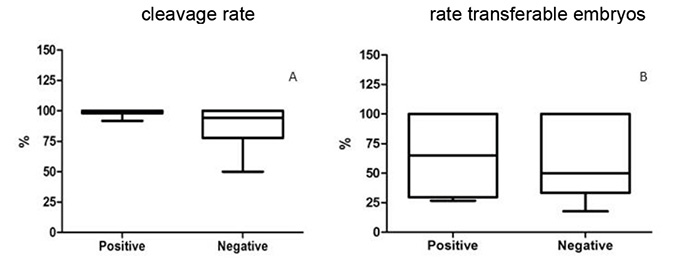
Figure 2: Representation of Whisker plots (min to max) of the data obtained from the analysis of histones in the sperm chromatin of patients undergoing in vitro fertilization procedures grouped into subjects positive for pregnancy versus individuals negative for pregnancy in relation to cleavage rates (Fig A); and rate of transferable embryos (Fig B).