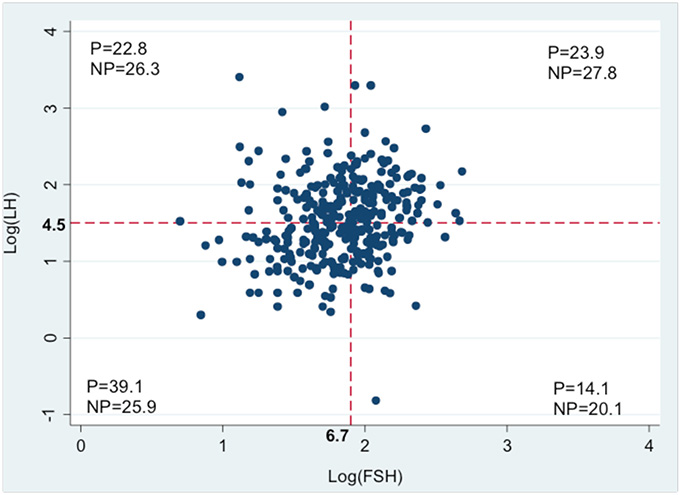
Figure 1. Bivariate correlation plot of logarithmically transformed baseline FSH and LH levels. By analysing all given combinations of FSH and LH levels and aiming at an optimal pregnancy rate in one of the quadrants, the ‘univariate cut-off levels’ for FSH (6.7 U/l) and LH (4.5 U/l) were provided and four groups of FSH–LH combinations could be determined. The mean pregnancy rate (P%) and non-pregnancy rate (NP%) is given in each group (quadrant). N is 351 IVF/ICSI treatment cycles.