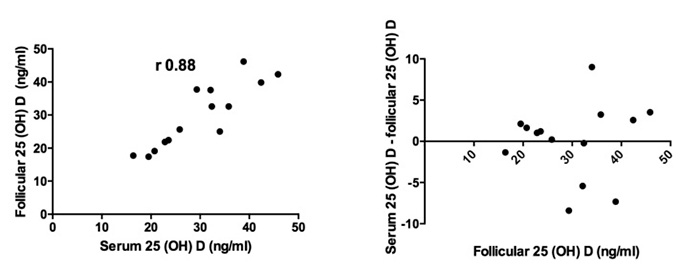
Figure 1. Follicular and Serum 25(OH) levels of 14 patients. Pearson’s correlation coefficient and Bland-Altman plots.