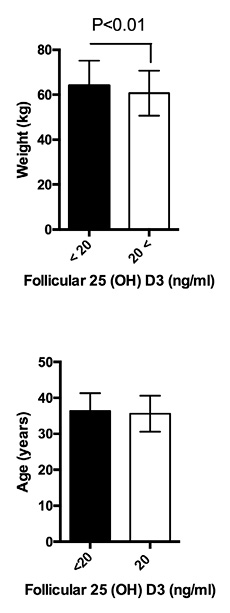
Figure 3. Weight (kg) and age (years) of patients with >20ng/ml and <20ng/ml of 25(OH) D3. Bars represent mean values and standard deviation.
Figure 3. Weight (kg) and age (years) of patients with >20ng/ml and <20ng/ml of 25(OH) D3. Bars represent mean values and standard deviation.