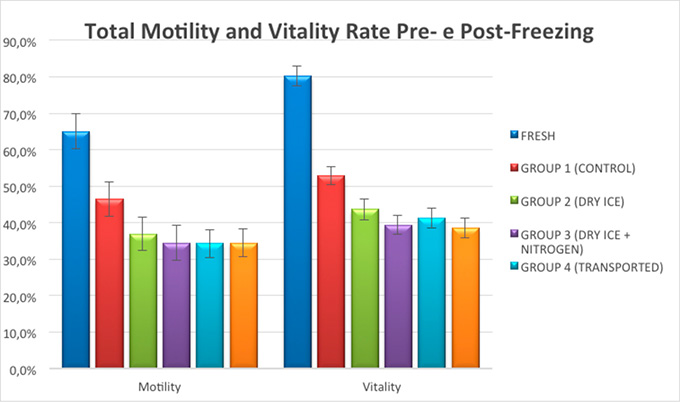
Figure 1. Mean percent distribution of motility rates and vitality for samples from different groups before and after freezing.
Figure 1. Mean percent distribution of motility rates and vitality for samples from different groups before and after freezing.