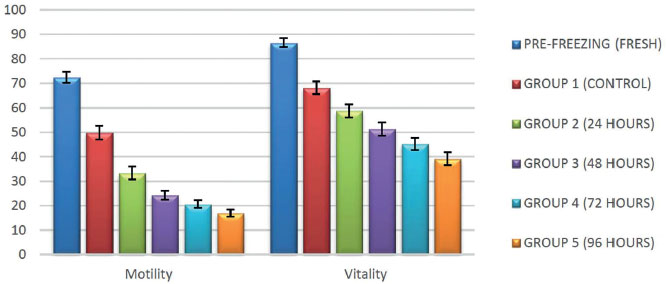
Figure 1. Mean value, in percentage, of the total motility rate and vitality of the samples for the different pre- and post-freezing groups.
Figure 1. Mean value, in percentage, of the total motility rate and vitality of the samples for the different pre- and post-freezing groups.