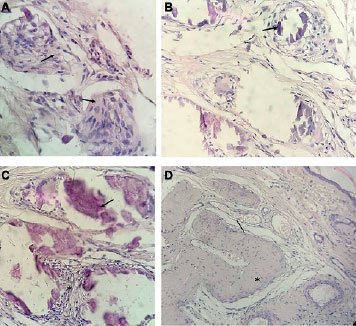
Figure 3. Sample graft representation 2 months after implant. A, presence of macrophages (arrows) near degenerated seminiferous tubules. B, presence of necrosis in degenerated tubules (arrow). C, coagulative necrosis (arrow) and lymphocytic interstitial infiltrate (asterisk). D, Presence of vascularization (arrows) surrounding seminiferous tubule (asterisk).