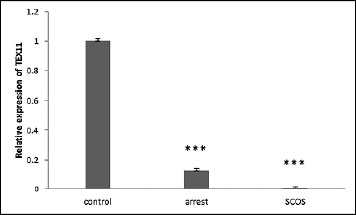
Figure 1. Comparison of the expression levels of TEX11 between MA, SCOS, and control patients. *** p<0.05.