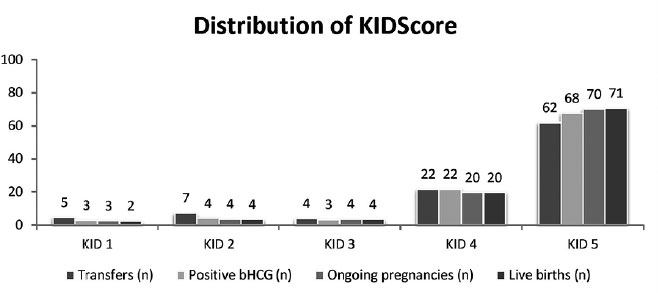
Figure 4. Distribution of the KIDScore - all embryos included. The figure shows the percentage of each KIDScore class on different categories (number of transfers, number of positive pregnancy tests, number of ongoing pregnancies, and number of live births).