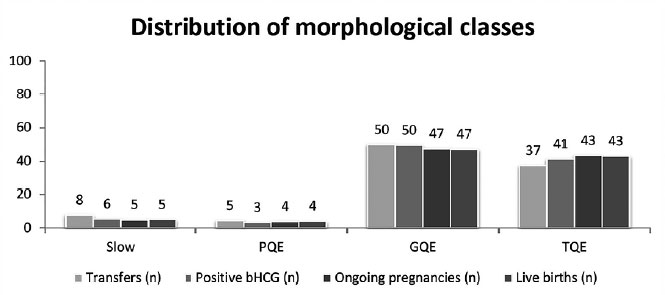
Figure 6. Distribution of morphological classes, all embryos included in the study. The figure shows the percentage of each morphological class on each category (number of transfers, number of positive pregnancy tests, number of ongoing pregnancies, and number of live births). Surprisingly, the majority of embryos are ranked as second highest class GQE, not in the best class, with very few embryos in the poorest categories. PQE = poor quality embryo, GQE = good quality embryo, TQE = top quality embryo.