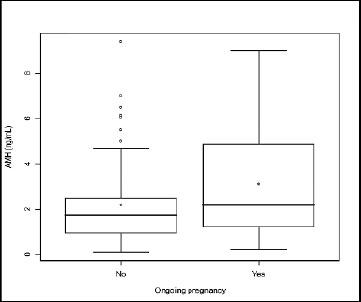
Figure 2. Comparison between serum anti-Müllerian hormone (AMH) levels of infertile patients with ongoing pregnancies and infertile patients without ongoing pregnancies. The box represents the interquartile range containing 50% of the values. The whiskers are lines that extend from the box to the highest and lowest values, excluding outliers. A line across the box indicates the median. p<.05, Student's t-test.