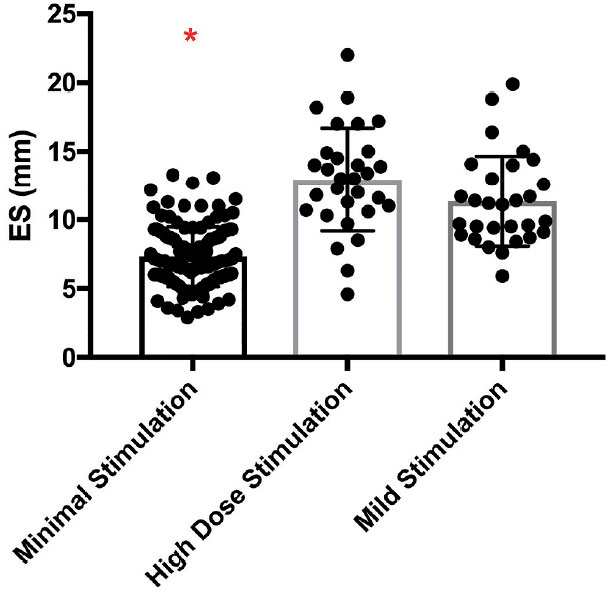
Figure 2. Comparison of endometrial thickness according to IVF protocol. Comparison of the peak endometrial stripe during minimal stimulation IVF, high dose GnRH antagonist, and mild stimulation IVF. Note: The posthoc analysis indicated that the high dose and mild stimulation groups were statistically significantly different from the minimal stimulation group as indicated by the red asterisk.
* indicates p<0.01