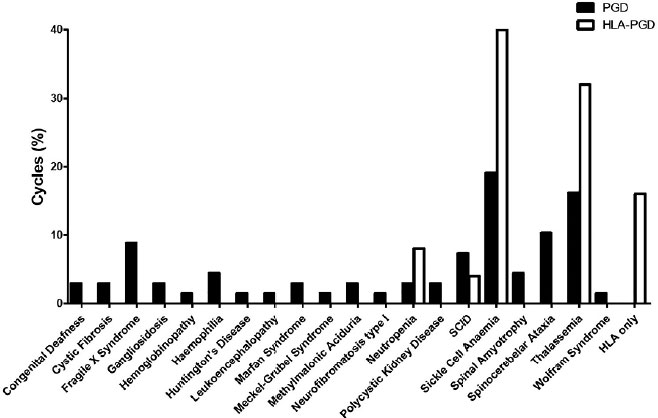
Figure 2. Cumulative proportion of PGT-M and HLA PGT-M cycles per monogenic disease indication, from 2011 to 2016.
Figure 2. Cumulative proportion of PGT-M and HLA PGT-M cycles per monogenic disease indication, from 2011 to 2016.