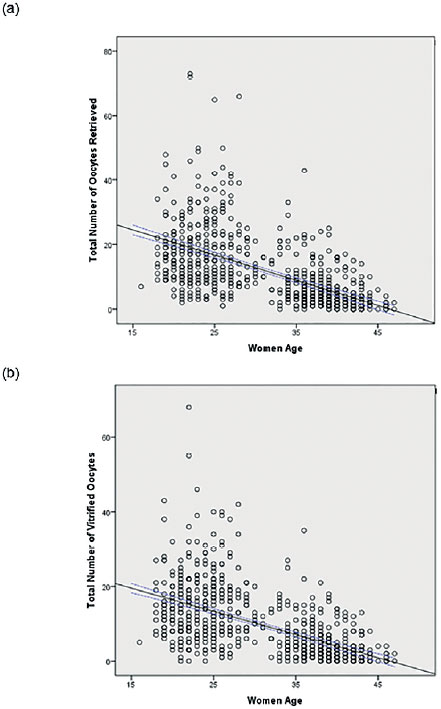
Figure 1. A scatter plot distribution showing the number of oocytes retrieved (a) and number of vitrified oocytes by age (b)
Figure 1. A scatter plot distribution showing the number of oocytes retrieved (a) and number of vitrified oocytes by age (b)