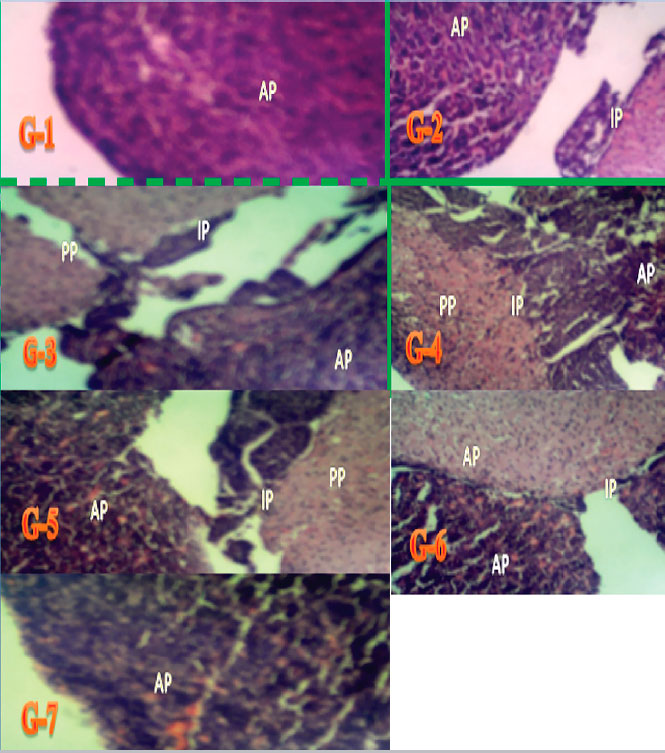
Plate 2. Representative pituitary gland micrographs of Wistar rats from Groups 1-7 showing areas of degenerative change. The posterior pituitary (PP), the anterior pituitary gland (AP) with increase basophil (B) and acidophil (A) cell counts and few chromophobe cells (C). Staining: H&E. Magnification: x400.