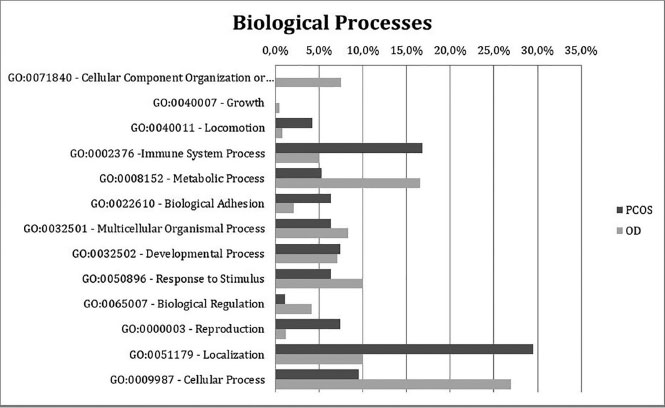
Figure 3. Chart indicating the percentages of exclusive and upregulated FF proteins from the PCOS (dark grey) and OD (light grey) groups classified according to biological processes based on the Gene Ontology database
Figure 3. Chart indicating the percentages of exclusive and upregulated FF proteins from the PCOS (dark grey) and OD (light grey) groups classified according to biological processes based on the Gene Ontology database