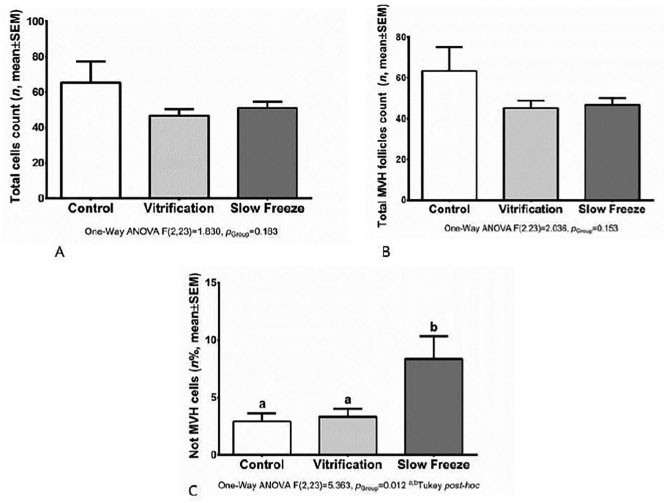
Figure 3. A: No statistical difference among groups in total cell count number (p=0.183). B: No statistical difference in total follicles count (p=0.153). C: Statistical difference among groups in percentage number of MVH+. Slow freeze group had a higher number of unstained cells (p=0.012).