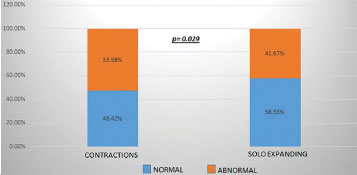
Graph 1. Embryo euploidy rate according to type of movement: contraction vs. expansion only (“solo expanding”). Euploidy rates were significantly different between the SE and CT groups (p=0.029).
Graph 1. Embryo euploidy rate according to type of movement: contraction vs. expansion only (“solo expanding”). Euploidy rates were significantly different between the SE and CT groups (p=0.029).