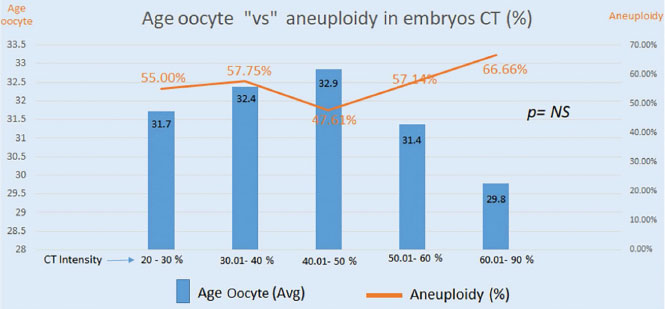
Graph 5. Embryos divided into five groups based on percent contraction (blue bars). Group 1 (n=55); Group 2 (n=59); Group 3 (n=42); Group 4 (n=14); Group 5 (n=9). The discrepancies seen in Groups 4 and 5 may be ascribed to the small number of embryos in each of the two groups.