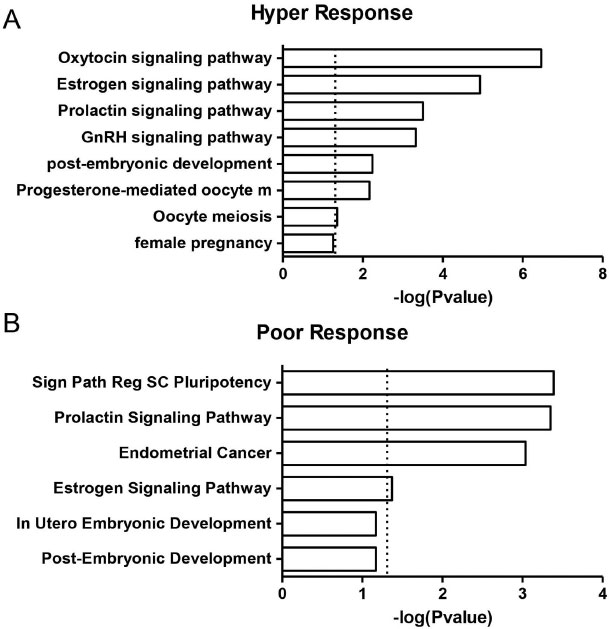
Figure 1. Gene set enrichment analysis of differentially detected miRNAs in HR and PR groups. The bars represent biological processes and signaling pathways enriched among the predicted target genes of the miRNAs from HR and PR groups. Values on the x-axis are represented as -log p values.