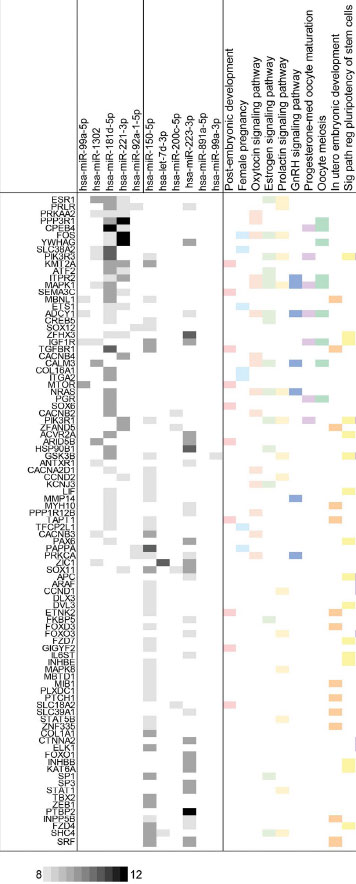
Figure 2. miRNAs from HR and PR groups and their target genes. Representative list of miRNA targets and enriched processes. The grey boxes indicate the number of prediction algorithms that consider that interaction possible (from 8 to 12) using the miRWalk web tool. Colored boxes indicate that each target gene is annotated in the given ontological category according to the DAVID platform.