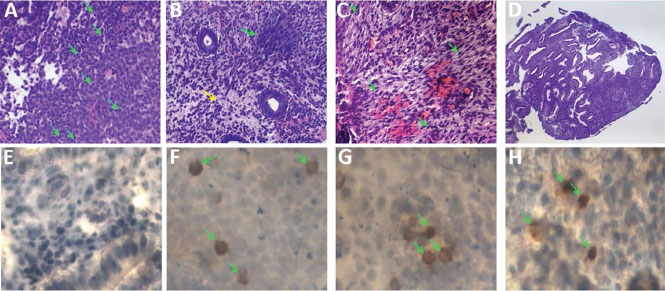
Figure 1. Staining of tissue samples showing (A) Plasmatic Cells, (B) Stromal edema and elevated Stromal density, (C) Spindle Stromal cells, (D) micropolyps, (E) Normal CD138, (F) High CD138, (G) High CD56 and (H) High CD20
Figure 1. Staining of tissue samples showing (A) Plasmatic Cells, (B) Stromal edema and elevated Stromal density, (C) Spindle Stromal cells, (D) micropolyps, (E) Normal CD138, (F) High CD138, (G) High CD56 and (H) High CD20