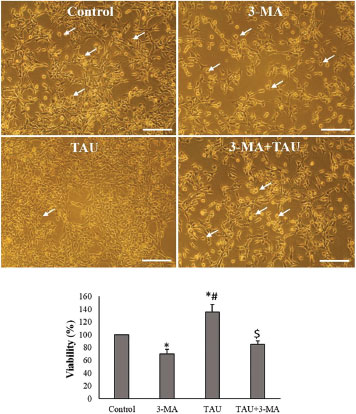
Figure 2. Morphology (above images) and viability (the following pictures) of TM3 cells in experimental and control groups (Scale bar: 100 µm). The arrows indicate apoptotic morphology. The values are expressed as mean ± SD. *p<0.05, #p<0.05, $p<0.05; *, # and the $symbols respectively indicate comparison to the control, 3-MA and TAU groups.