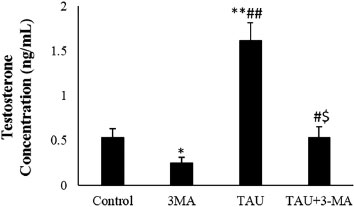
Figure 3. Testosterone concentration in the control and experimental groups. The arrows indicate apoptotic morphology. The values are expressed as mean ± SD. *p<0.05, **P<0.01, #p<0.05, ##p<0.01, $p<0.05; *, # and the $ symbols respectively indicates comparison to the control, 3-MA and TAU groups.