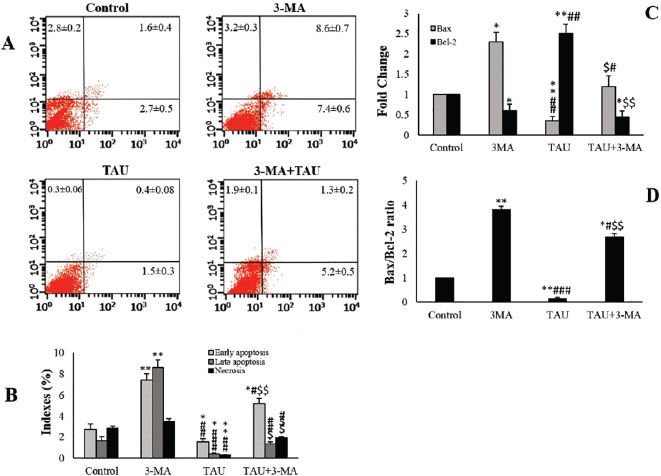
Figure 4. Flow cytometry of Annexin / PI staining in the experimental & control groups. Lower left quadrant: live cells; Lower right quadrant: initial apoptosis; Upper right quadrant: late apoptosis; Upper left quadrant: necrotic cells (A and B). The relative level of mRNA expression of Bax and Bcl-2 genes and Bax/Bcl-2 ratio (C and D). The values are expressed as mean±SD. *p<0.05, **p<0.01, #p<0.05, ##p<0.01, ###p<0.001, $p<0.05, $$p<0.01; *, # and the $ symbols respectively indicate comparison to the control, 3-MA and TAU groups.