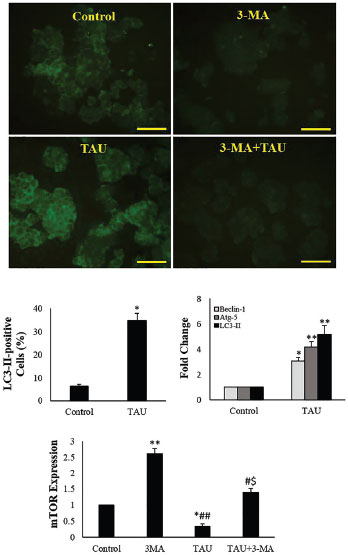
Figure 5. Immunofluorescent microscopy of the TM3 cells, percentage of LC3-II-positive cells and expression of autophagy-related genes. The bright green staining indicates LC3-II-positive cells (scale bars: 100 µm). The values are expressed as mean±SD; *p<0.05, **p<0.01, #p<0.05, ##p<0.01, $p<0.05; *, # and the $ symbols respectively indicate comparison to the control, 3-MA and TAU groups.