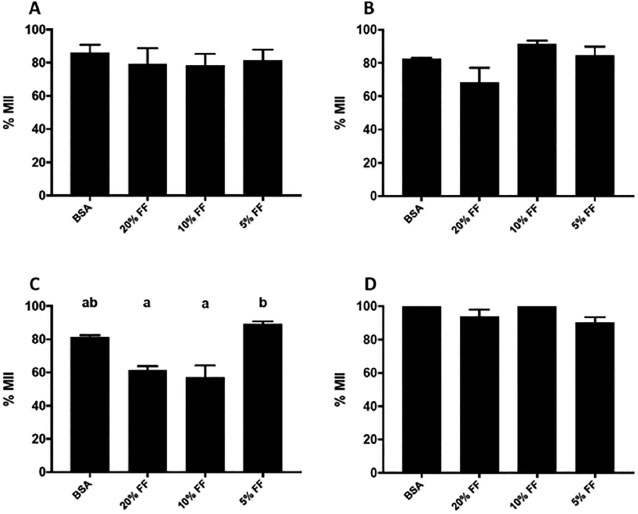
Figure 1. Proportion of maturing oocytes following exposure to patient FF (with and without the addition of antioxidants). A & B, Oocytes exposed to FF of patients of advanced maternal age with and without the addition of antioxidants (A & B, respectively). C & D, Oocytes exposed to FF of individuals with endometriosis, with and without the addition of antioxidants (C & D, respectively).Values are presented as mean±SEM.Different letters denote statistical differences among conditions (p<0.005)