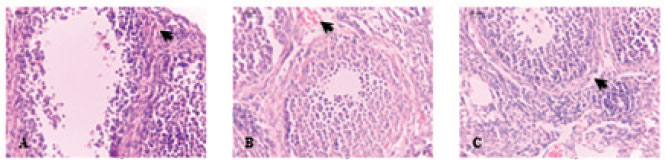
Figure 1. The comparison of quantitative ovarian parameters (Ovarian vascular density and ovarian vessel area) between the control group and case groups (light microscopy, 400× magnification) found a significant difference at pre-implantation time. The arrow shows the ovarian vessels. Control group [A], Ovarian stimulation group [B], and P4-treated group [C].