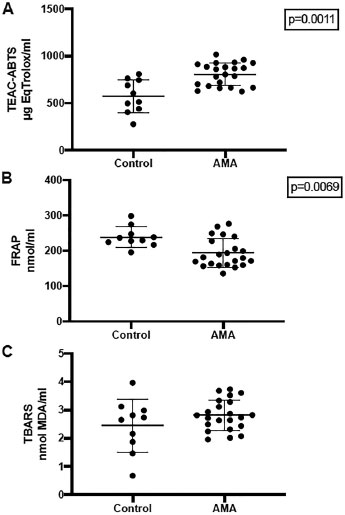
Figure 1. Scatter dot plot of ABTS (A), FRAP (B) and TBARS (C) values in both groups (Control and Advanced-maternal-age AMA patients)The Control group is represented by samples from donors from our oocyte donation program.The values are represented in specified units. Statistical significance is described within the graph.