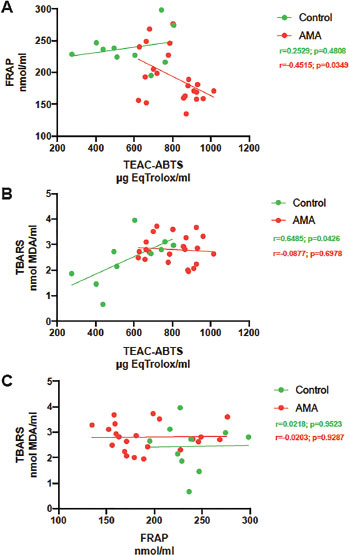
Figure 2. Correlation between ABTS, FRAP and TBARS values for both groups (Control and Advanced-maternal-age AMA patients)The Control group is represented by samples from donors from our oocyte donation program.The values are represented in the specified units. Statistical significance is described in the graph. A) ABTS vs FRAP; B) ABTS Vs TBARS; C) FRAP Vs TBARS