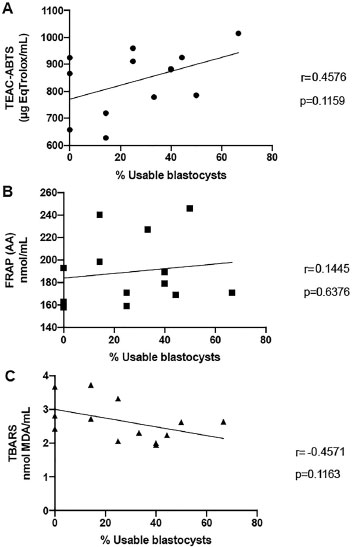
Figure 3. Correlation between the ABTS, FRAP and TBARS values of patients with Advanced-maternal-age and percentage of usable blastocystsThe values are represented in the specified units.Statistical significance is described in the graph.A) ABTS; B) FRAP; C) TBARS