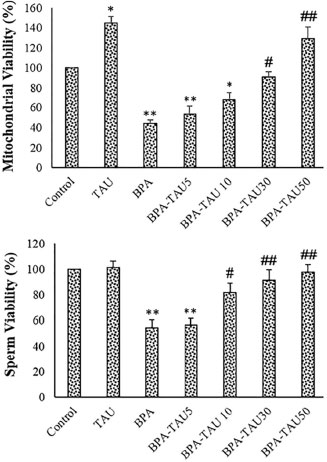
Figure 2. Viability percentage of the isolated mitochondria and sperms. The mean ± standard deviations are shown (n=6).* p<0.05, ** p<0.01, # p<0.05, ## p<0.01; * and # symbols show comparison to the control and BPA groups, respectively.
Figure 2. Viability percentage of the isolated mitochondria and sperms. The mean ± standard deviations are shown (n=6).* p<0.05, ** p<0.01, # p<0.05, ## p<0.01; * and # symbols show comparison to the control and BPA groups, respectively.