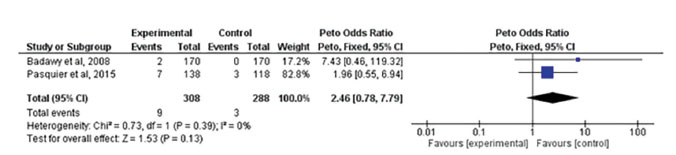
Figure 9.
Forest-plot of congenital abnormality incidence with treatment