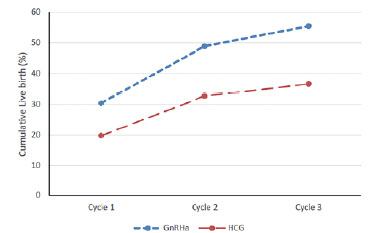
Figure 2. Cumulative Live birth rate per patient in FET cycles following GnRHa trigger (blue dotted line) and hCG trigger (red dotted line).
Figure 2. Cumulative Live birth rate per patient in FET
cycles following GnRHa trigger (blue dotted line) and
hCG trigger (red dotted line).