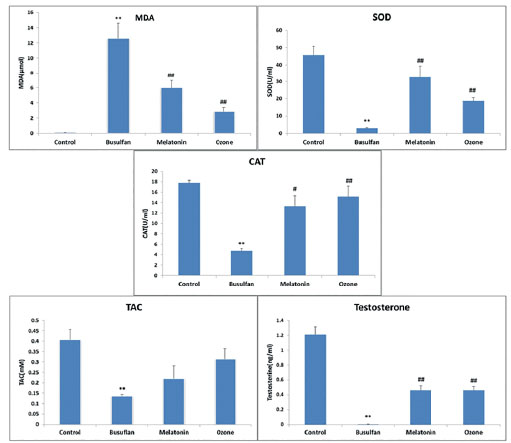
Figure 1. MDA, SOD, Catalase, TAC and testosterone biomarker levels in all study groups. Values are expressed as Means±SD. **p<0.01 or *p<0.05 compared with the control group, ##p<0.01 or #p<0.05 compared with the busulfan group.
Figure 1. MDA, SOD, Catalase, TAC and testosterone biomarker levels in all study groups. Values are expressed as Means±SD. **p<0.01 or *p<0.05 compared with the control group, ##p<0.01 or #p<0.05 compared with the busulfan group.