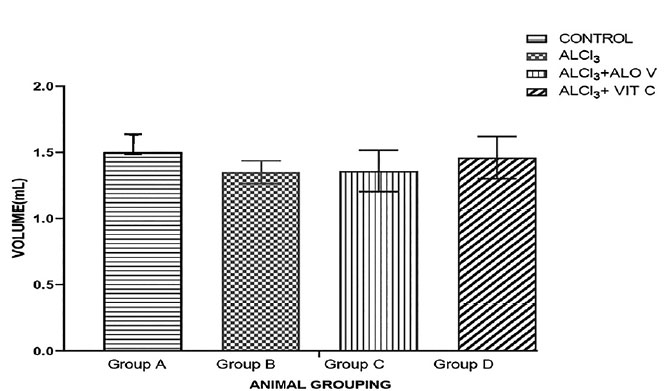
Figure 3. Graph showing sperm volume across the groups. Bars represent Mean ± SEM. p<0.05. n=5. Each value represents Mean±SEM, n=5 readings. Value of p<0.05 was considered significant.
Figure 3. Graph showing sperm volume across the groups. Bars represent Mean ± SEM. p<0.05. n=5. Each value represents Mean±SEM, n=5 readings. Value of p<0.05 was considered significant.