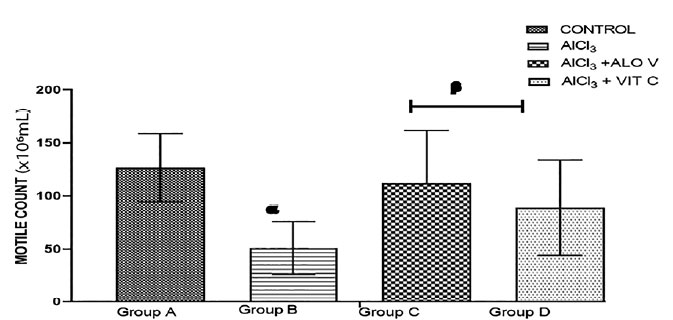
Figure 4. Graph showing the motile count of sperm cells across groups. Each value represents Mean+SEM, Value of p<0.05 was considered significant. Charts with superscript α (alpha) is significantly different from group A, superscript β (beta) is significantly different from group B.