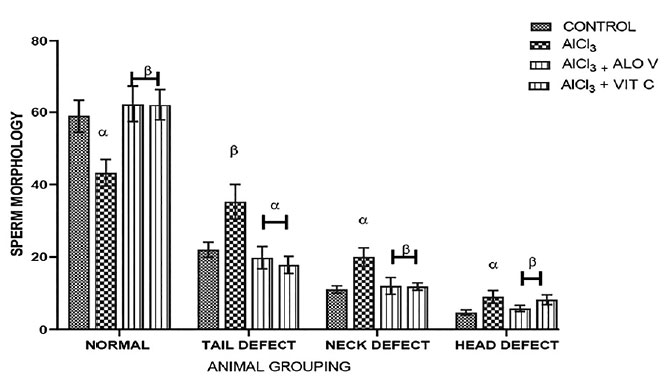
Figure 7. Graph shows the sperm morphology across the groups. Each value represents Mean±SEM, n = 5 readings. A p value <0.05 was considered significant. Effects of Aloe vera gel on sperm morphology. The values with superscript α are significant different from Group A, β=different from Group B