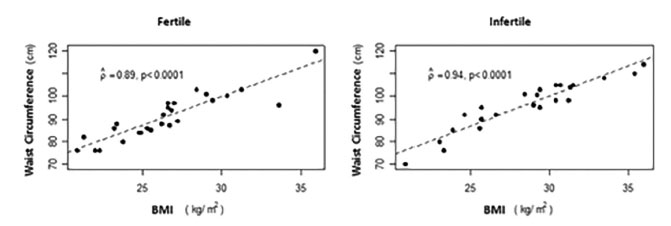
Figure 1.
Scatter plot between waist circumference (cm) and body mass intake (Kg/m
2
) by group