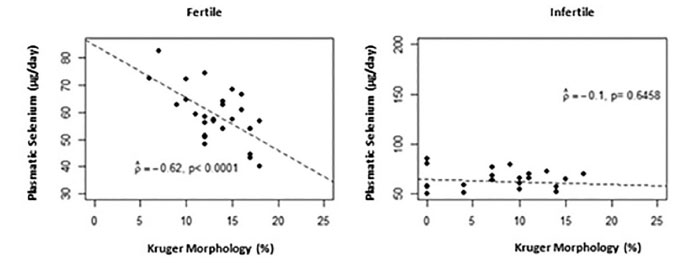
Figure 4.
Scatter plot between plasmatic selenium (μg/day) and Kruger morphology (%) by group