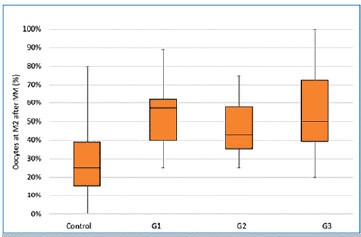
Figure 2. Box and whiskers plot of the percentage of oocyte reaching the metaphase II stage in the 4 groups tested in 11 repeats of the experiments. Control: no treatment, G1, G2, G3: treated groups (see figure 1). Boxes represent p25, p50, and p75; whiskers indicate positions of minimum and maximum values.